Your SEO tool shows you ranking #1 for “dentist near me.” Your phone calls haven’t changed in six months. Your Google Business Profile looks complete. You’ve got reviews. You’ve done everything right — at least according to the data in front of you.
Something doesn’t add up.
It isn’t bad luck, and it probably isn’t your SEO. Your ranking tool is giving you one number when the reality is 25 different ones — and the gap between what your tool shows and what your customers actually see could be costing you more business than you realise.
What Your Standard Rank Tracker Is Actually Measuring
Most rank trackers work the same way. You enter a keyword. They ping Google from one location — usually your city centre or a fixed server IP — and hand you back a single ranking position.
That number is real. It’s just not the whole picture.
Google Maps doesn’t serve everyone the same results. Rankings shift based on where the person searching is physically standing at that moment. Someone two blocks from your business sees something different from someone searching in the next suburb. A potential customer across town might not see your listing at all — even if your rank tracker confidently tells you that you’re sitting at position three.
Your standard tool picks one point, checks once, and calls it done.
For broad organic search, this approximation is workable. Keyword rankings are fairly consistent across a city for most terms. But for Google Maps — where physical proximity is one of the strongest ranking signals Google uses — a single-point check isn’t an approximation. It’s a different measurement entirely.
What a Geo-Grid Rank Checker Does Differently
A geo-grid rank checker pulls your Google Maps ranking from multiple geographic points simultaneously, not just one.
GeoRankLand checks your ranking across 25 points arranged in a 5×5 grid around your business location. Each point represents a different physical location — a different street, a different neighbourhood, sometimes a different suburb entirely. The grid spans the area around your business in every direction, and the result is a heat map of where you’re visible and where you’ve effectively gone dark.
Instead of “you rank #4,” you see something like this:
You rank #1–3 across the 9 points within 1km of your business
You hold at #5–7 between 1–2km out
You drop to #14 or lower beyond 2km to the north
You disappear entirely beyond 2.5km to the east
That is a completely different picture. And it’s the accurate one. Not just more detailed — fundamentally more useful, because it tells you exactly which parts of your city you’re winning and which you’ve already lost.
The Proximity Wall Problem
There’s a pattern that shows up in almost every scan we run, across industries and cities. A business looks strong close to its physical address. Rankings hold in the immediate area — the streets and blocks right around the front door. Then somewhere between 1.5km and 3km out, they fall off a cliff.
We call this the proximity wall.
It exists because Google heavily weights physical distance when ranking businesses on Maps. The further a searcher is from your registered address, the harder it becomes for your listing to compete — especially when there’s a competitor sitting closer to them. From Google’s perspective, that competitor is simply more relevant to that searcher’s location.
Your standard rank tracker won’t show you this wall exists. It doesn’t know where the wall is. A geo-grid rank checker shows you exactly where it is, how steep the drop-off is, and which directions it’s most severe.
A London plumber we scanned had a Visibility Score of 54/100. On the surface that looks like reasonable coverage. When we pulled the full grid, two areas — Brompton and Chelsea, both within 3km of the business — showed up as completely invisible. The business was ranking nowhere in those postcodes. Both are high-value residential areas with strong demand for exactly the service they offer. The owner had no idea. Their rank tracker had never flagged it because it was never looking there.
Why This Matters More for Some Businesses Than Others
If your business operates entirely online, this matters less. A SaaS company or an e-commerce store doesn’t rely on someone finding them on Maps while standing on a particular street.
But if customers need to find you on Google Maps before they call you, book with you, or walk through your door — this is everything.
Dentists, lawyers, plumbers, roofers, physios, accountants, mortgage brokers, chiropractors — any business where the customer’s search starts with “near me” or a location — these are the businesses where a single rank number gives you a genuinely false sense of security. You’re not just missing data. You’re making decisions based on the wrong data.
Consider what actually happens when someone searches “dentist near me” on their phone. Google factors in where they are right now. If your practice is 3km away and a competitor is 800m away, that competitor almost certainly outranks you for that search — regardless of what your ranking tool says back at the office.
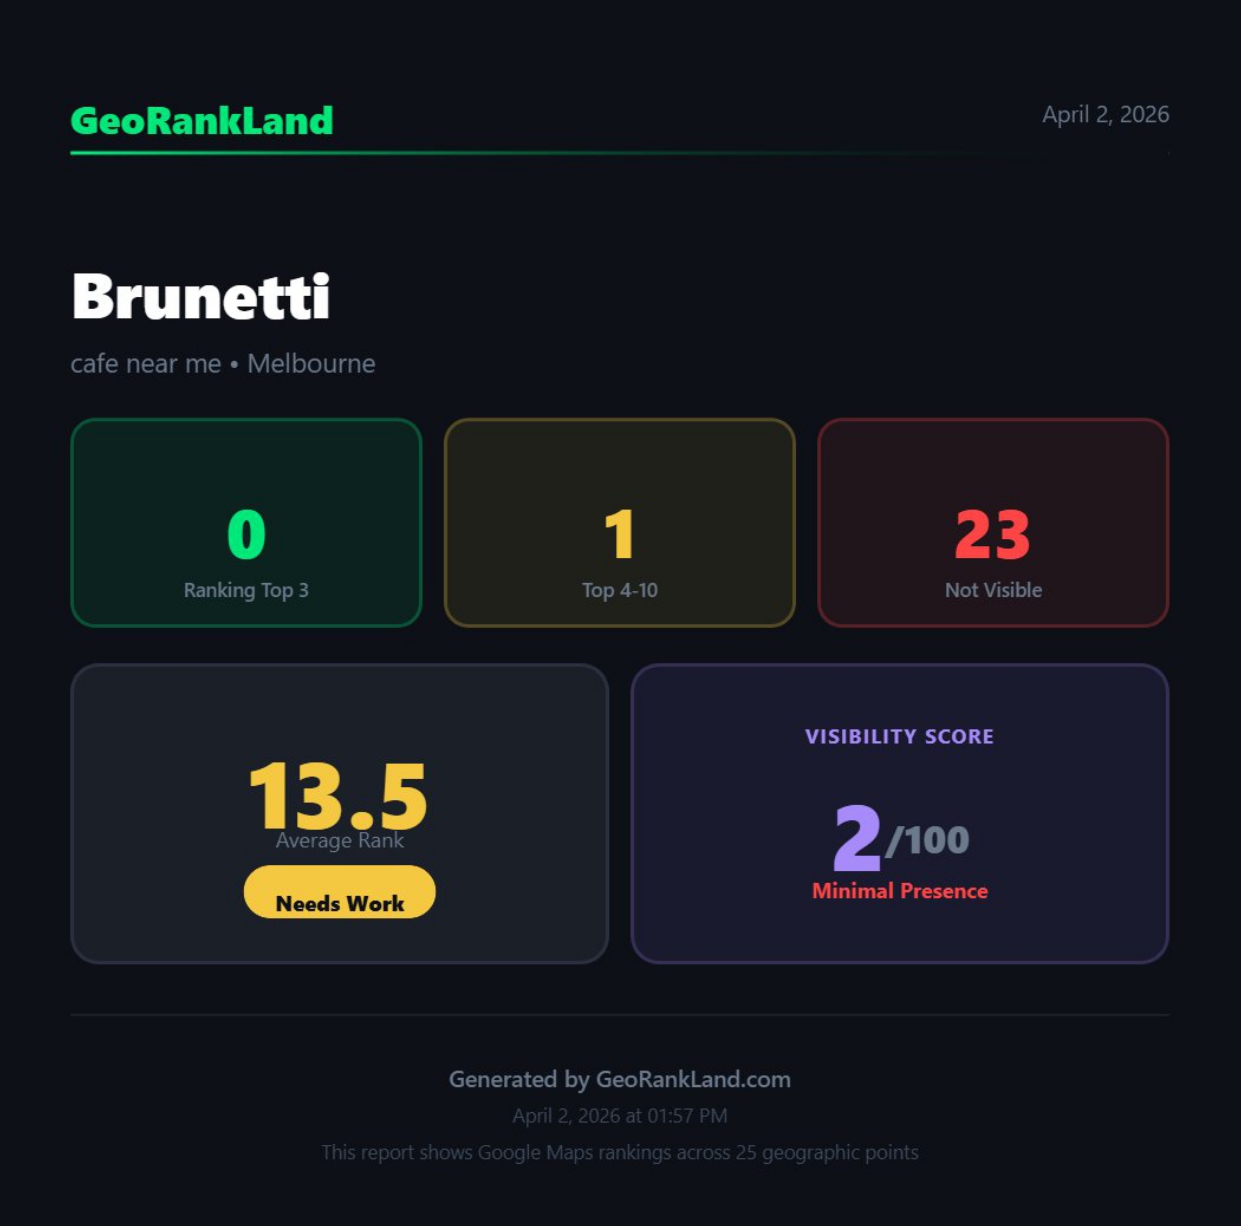
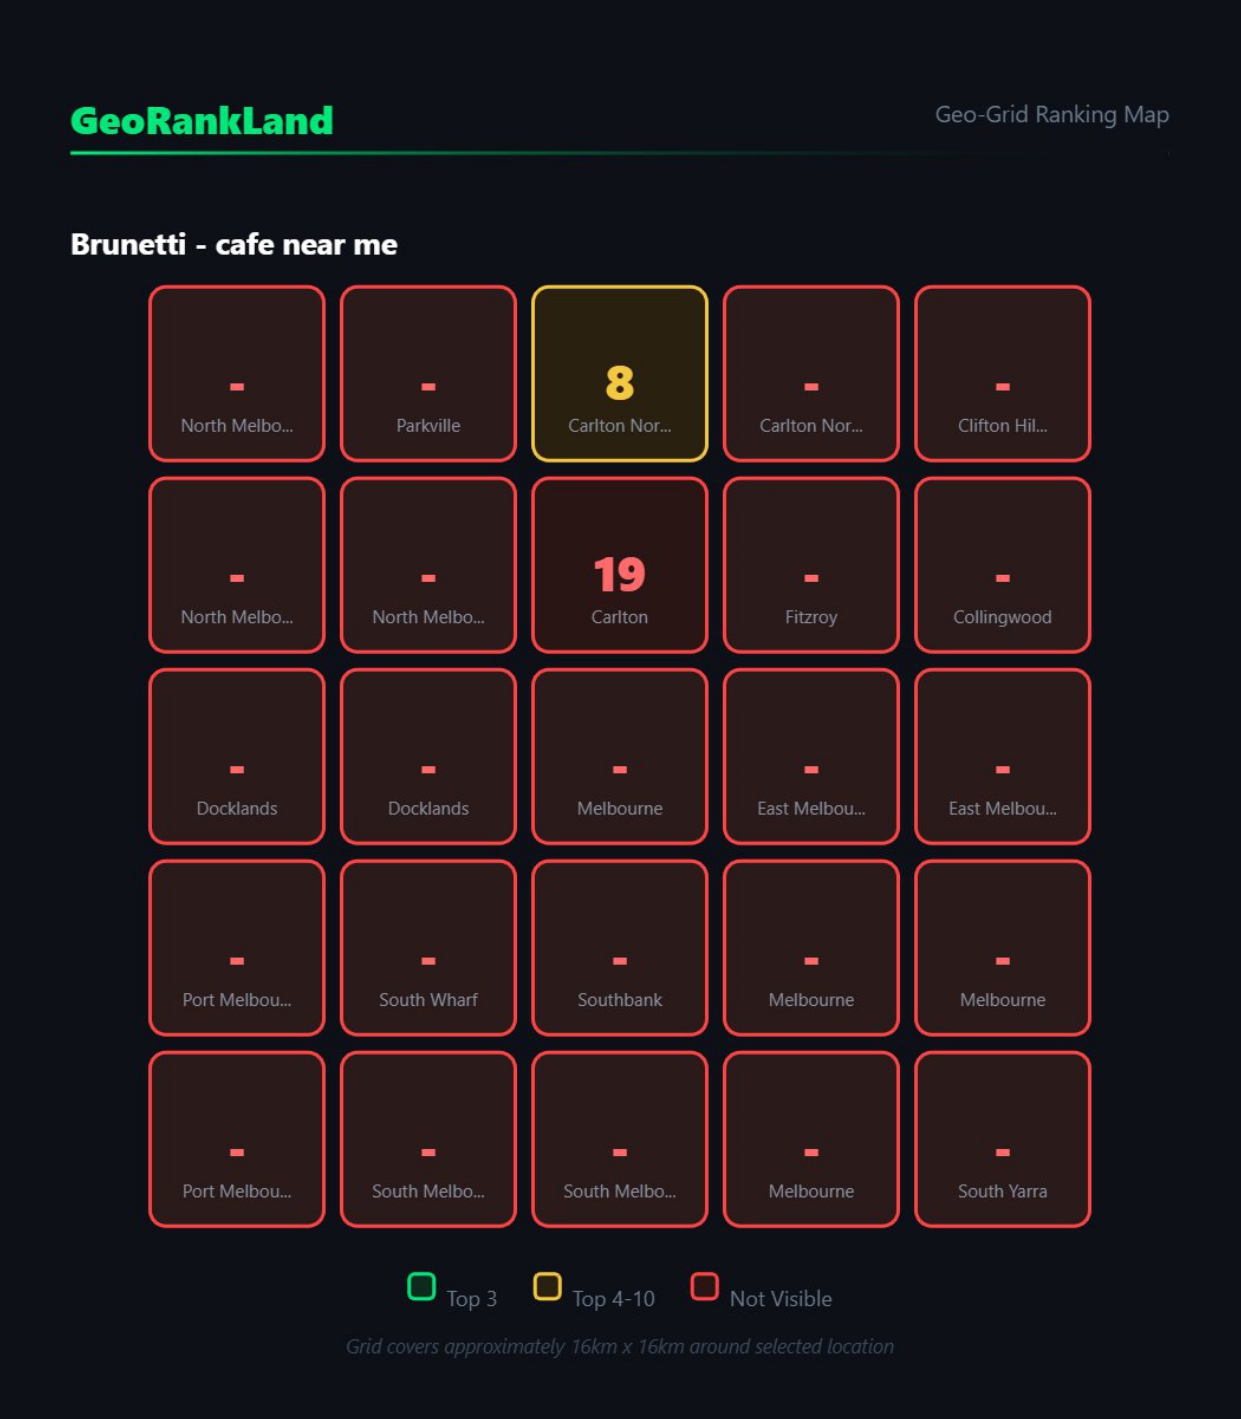
A Melbourne cafe we scanned had a Visibility Score of 2/100. That means 23 out of 25 grid points showed the business as effectively invisible on Google Maps. Completely off the map for the vast majority of people searching for a cafe in that area. Their owners were probably looking at a rank tracker that told them they appeared somewhere in the top 20 for “cafe near me.” Technically not wrong. Practically meaningless.
This is one of the more frustrating gaps in how local SEO is typically reported — and it’s why businesses keep spending money on optimisation without seeing the results they expect. The metric they’re watching isn’t measuring what they think it’s measuring.
What a Visibility Score Tells You
A geo-grid rank checker doesn’t just plot 25 coloured dots. It needs to turn that data into something you can act on — and something you can explain to a client in 30 seconds if you’re an agency.
GeoRankLand calculates a Visibility Score from 0 to 100 based on how many of the 25 grid points rank in the top 3 (weighted more heavily) versus top 4–10 (weighted lower). Points where the business doesn’t appear in the top 10 contribute nothing to the score. It reflects real geographic coverage — not an average rank position that can look fine while hiding serious dead zones.
The labels break down like this:
80–100: Local Dominant — you’re the clear choice across your entire service area
60–79: Core-Strong — solid near the centre, some natural drop-off at the edges
40–59: Mixed Coverage — visible in patches, invisible in others, inconsistent
20–39: Weak Outer Zones — only competitive in the immediate vicinity of your address
0–19: Minimal Presence — effectively off the map for most people searching
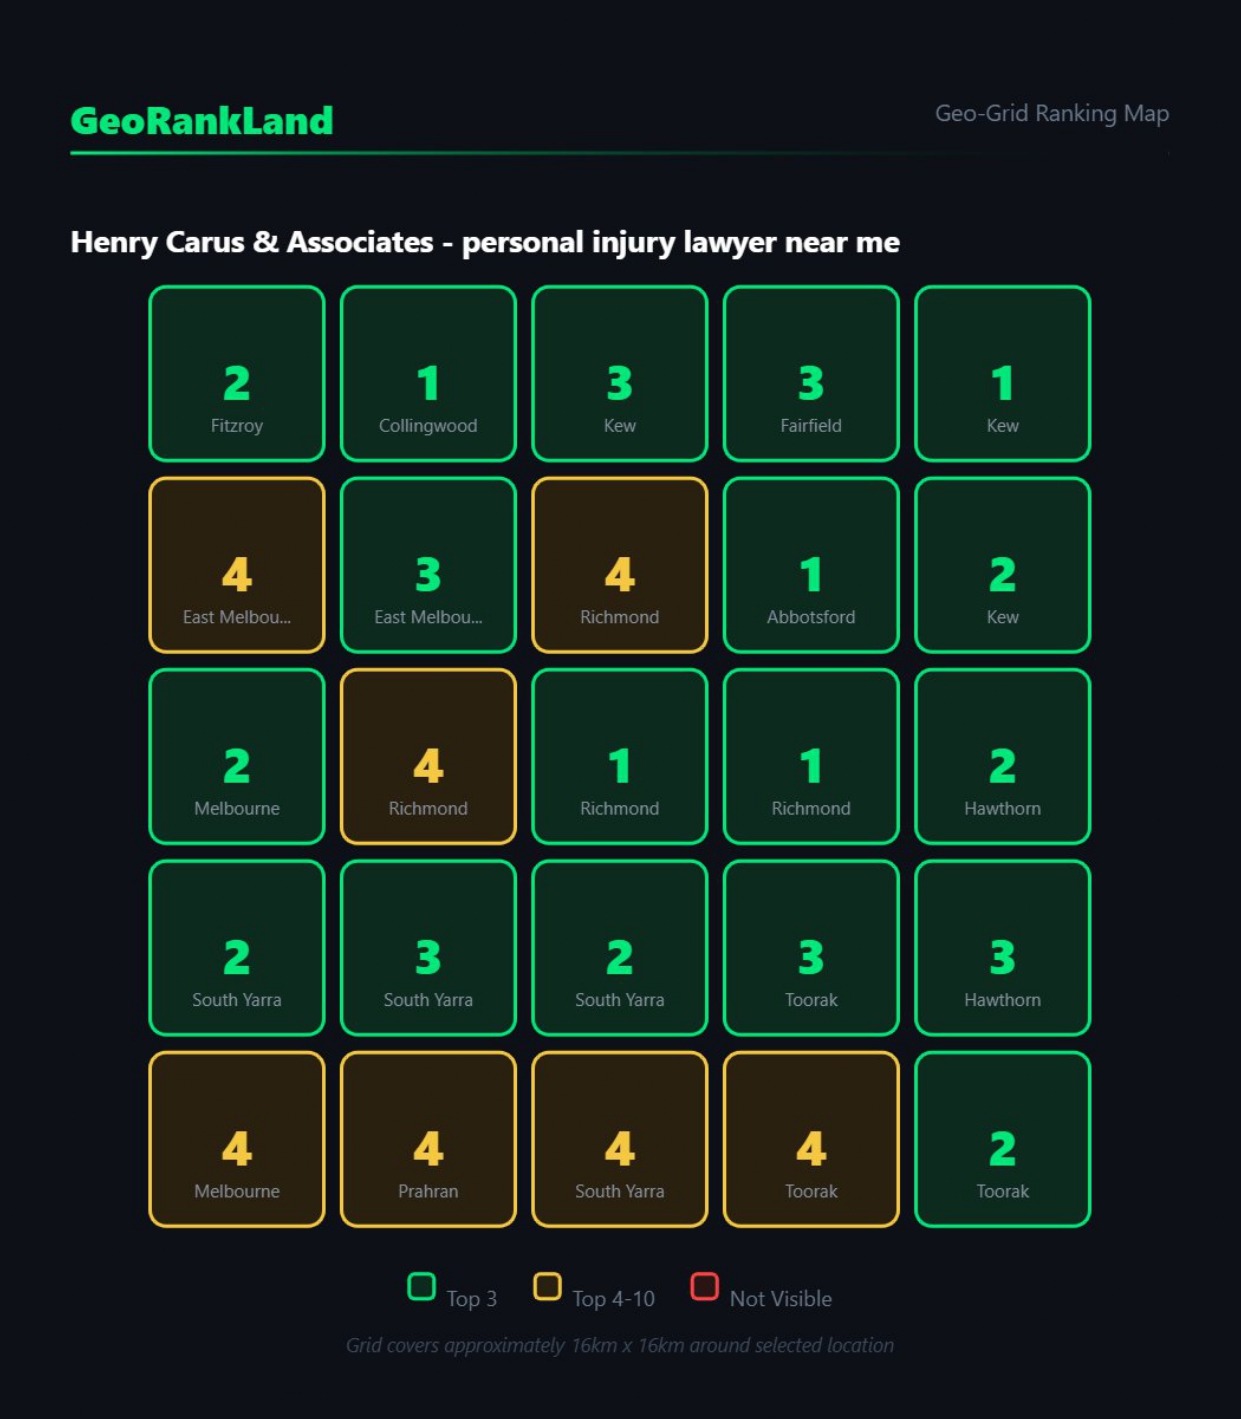
Henry Carus & Associates, a personal injury law firm in Melbourne, scored 86/100 — Local Dominant. That’s a strong result. But the grid showed two specific weak spots: Prahran and East Melbourne, both areas with high population density and strong demand for legal services. Competitors were winning those suburbs. Without the grid, a standard rank tracker would have told them everything was fine — and they’d have had no idea where to direct their next three months of SEO effort.
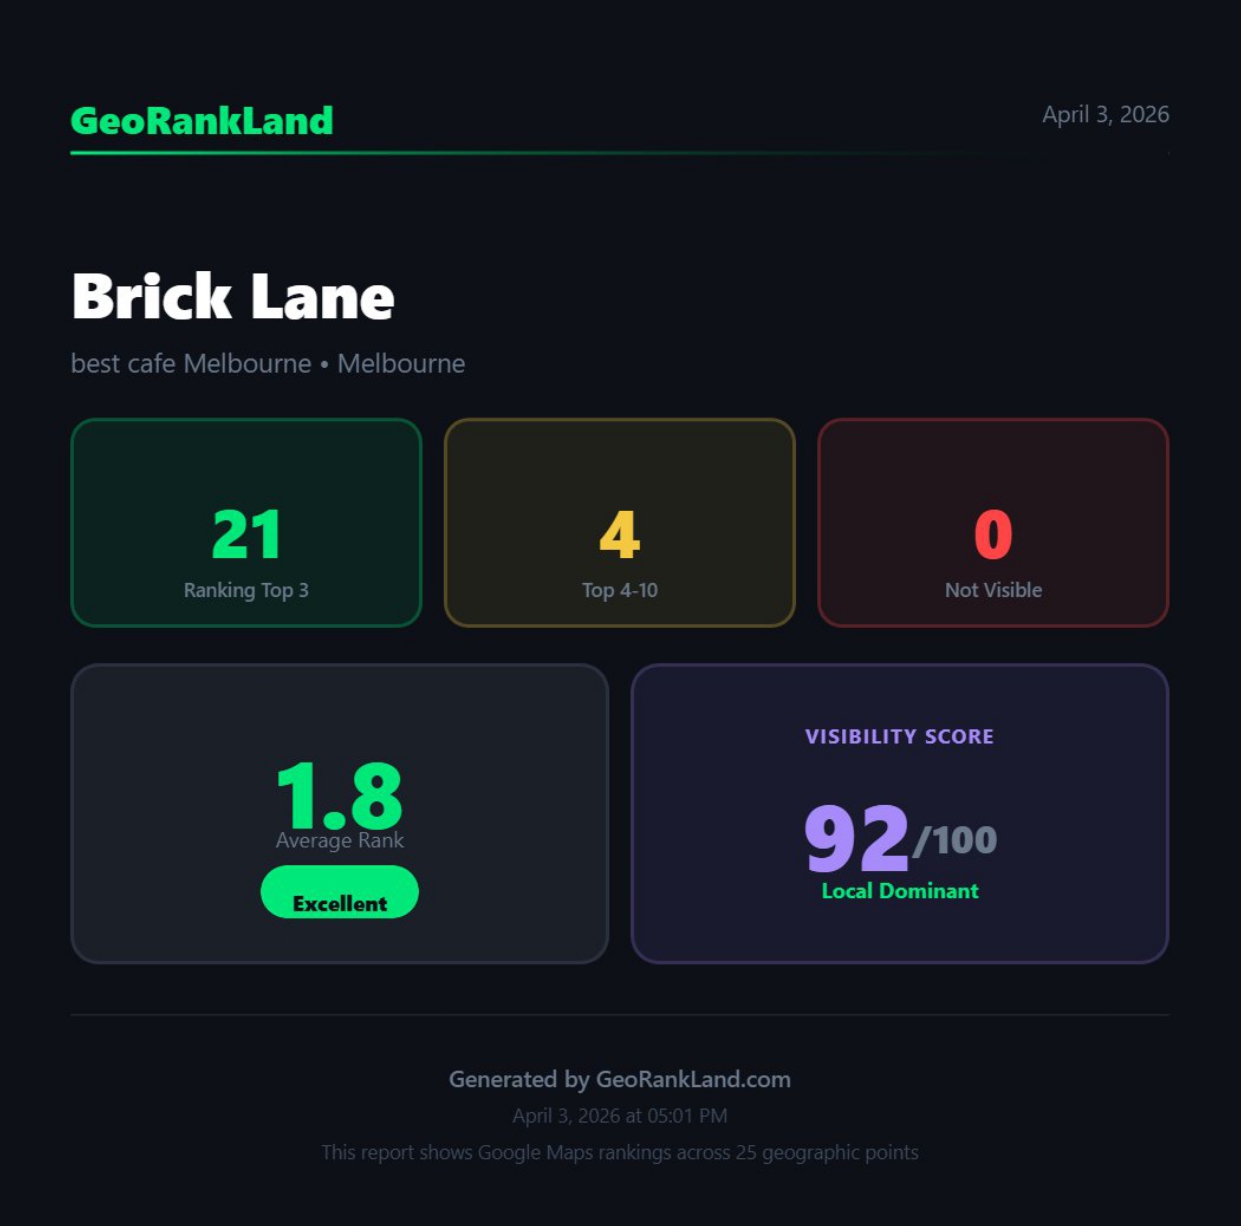
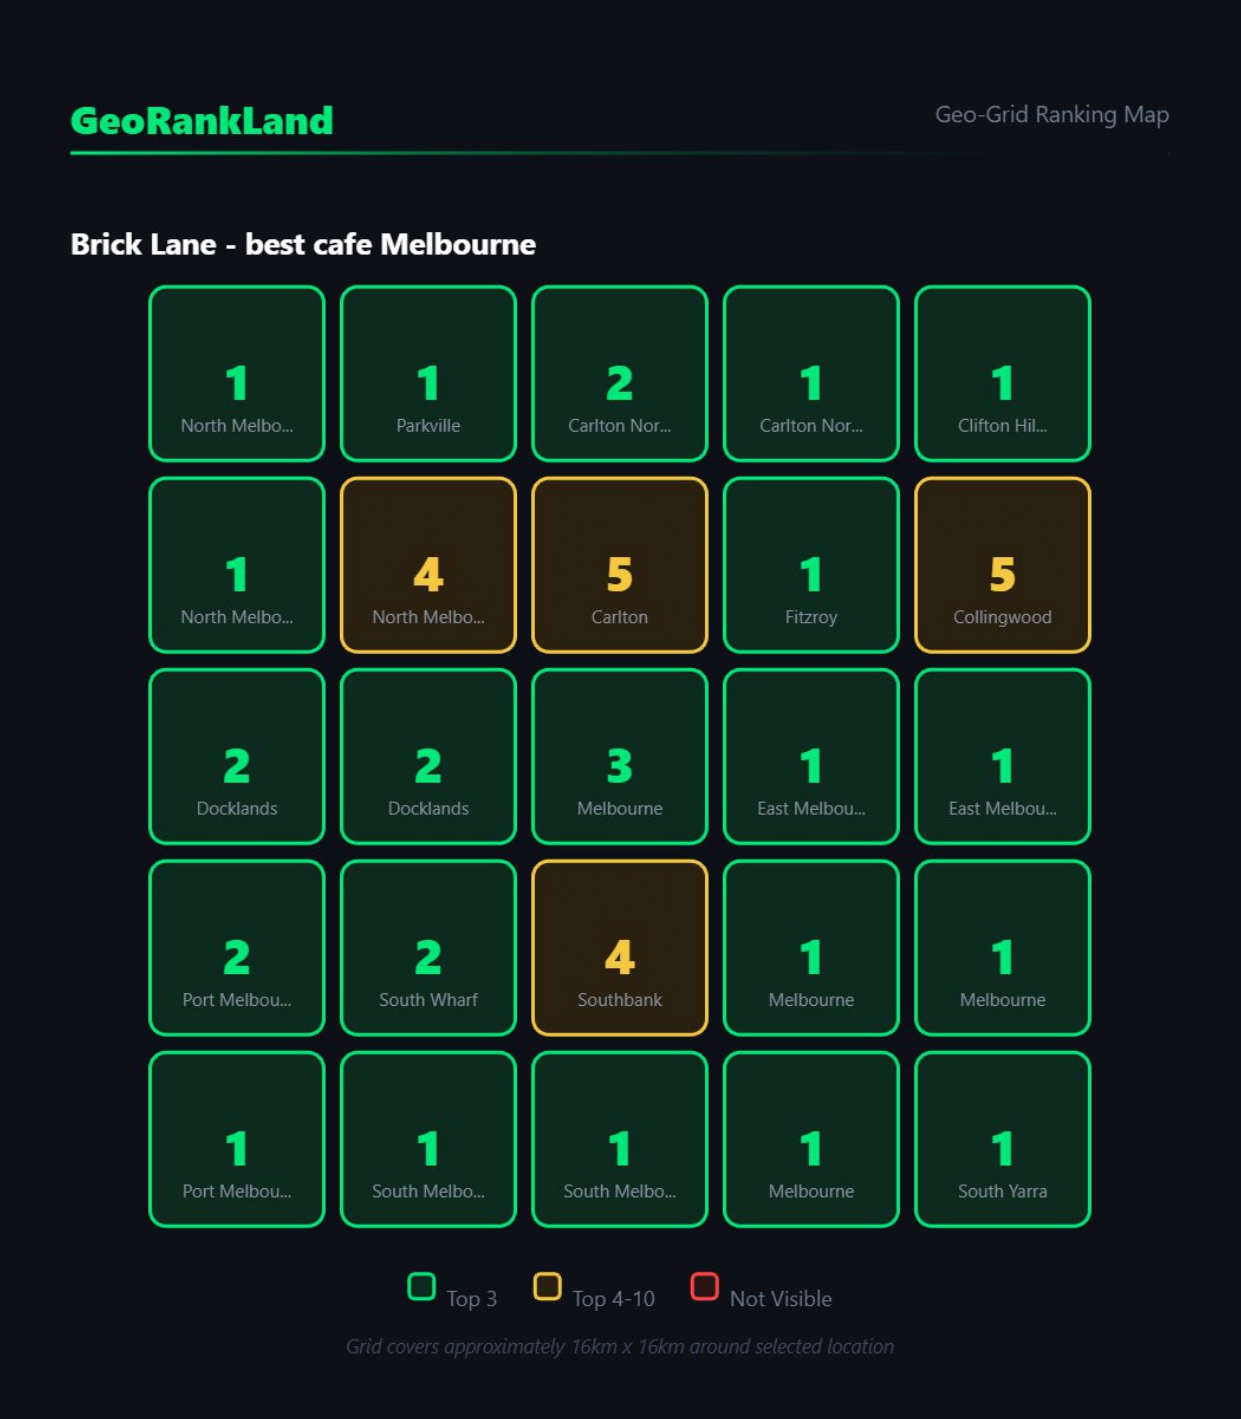
Brick Lane, another Melbourne cafe, scored 92/100 — 21 out of 25 grid points in the top 3. That’s what genuine local dominance looks like on a grid. That’s the benchmark.
What You Do With a Grid Scan
Knowing where you’re weak is only useful if it changes what you do next.
The grid gives you something specific to work with — and that specificity is where the value lives. If you’re invisible beyond 2km to the north but holding strong to the south, you have a direction. You can build citations from addresses in those northern suburbs. You can create Google Business Profile posts that specifically reference northern neighbourhoods and landmarks. You can look at which competitor is pulling rankings in that direction, check their review count and recency, examine their categories and service areas, and understand exactly what you’re up against.
Broad rank data leads to broad fixes. “Improve your local SEO” is not a strategy. “You’re invisible in Prahran — here’s what the business ranking there has that you don’t” is a strategy.
For agencies, this changes the client conversation entirely. You’re not showing a graph of a keyword position moving up or down by two places. You’re showing a client a map of where their business exists on Google and where it doesn’t. That conversation lands differently. It’s visible, intuitive, and it makes the problem — and the opportunity — immediately obvious to someone who isn’t an SEO professional.
The geo-grid is also a strong prospecting tool. Run a free scan on a potential client before your first meeting. Walk in with their grid already pulled. Show them the wall. Show them where they’re invisible. You haven’t pitched them yet — you’ve already shown them something their current agency hasn’t.
The Honest Limitation
A geo-grid rank checker shows you a snapshot in time. Rankings change — Google algorithm updates, competitors earn new reviews, a business down the street claims their listing and suddenly becomes a stronger rival. A single scan is directionally accurate, not a permanent map of the territory.
The value compounds when you scan regularly and track how the grid shifts over time. A score that was 54 three months ago and is now 41 tells you something is moving in the wrong direction, even if no individual action triggered it. That’s when you investigate.
The grid also doesn’t tell you why you’re weak in a particular area. That takes analysis — competitor proximity, review velocity, citation consistency, GBP completeness, category selection. The grid is the diagnostic tool. Understanding what’s driving the pattern, and fixing it, is still the work.
Where to Start
If you’ve never run a grid scan on your business — or on a client’s business — that’s the starting point.
Run a free scan at georankland.com. You’ll get your full 25-point grid, your Visibility Score with zone breakdown, and an AI Fix Report that identifies your strongest and weakest zones with specific recommendations tailored to your results. No generic advice — the report is built from your actual grid data.
If your standard rank tracker has been telling you things are fine, the grid will show you what fine actually looks like.
Most of the time, it looks different from what you expected.
Run a free scan at georankland.com — no account required to see your results.